Maximum Value Table (MVT) is one of the powerful tools in Modern QFD that is explained in the ISO 16355 standard. It lets you deploy the same focused of voice of customer analysis as the House of Quality (HoQ) matrix does, but with greater speed, efficiency, and focus. It is an invaluable tool when budget, manpower and development time are limited.
We teach MVT in our QFD Green Belt® training. Most attendees are able to begin using this fabulous tool in their work, once they get with it through hands-on practices in the class.
Occasionally, though, switching gears to this new, lean way of doing QFD causes uneasiness to some attendees who have had past exposure to legacy methods such as the classical QFD 4-phase/house methods. A common question they ask is whether to deploy customer needs into the Maximum Value Table or into the House of Quality and other Comprehensive QFD matrices. Some also voice apprehension, "By not employing a full-size House of Quality matrix, we might end up omitting something." These are valid concerns.
But let us assure you that you can not go wrong by starting first with the Maximum Value Table. Let us explain.
Since both MVT and HoQ are taught in the QFD Green Belt® class, we turn to some guidance from the training materials below. We will also discuss the pros and cons of MVT vs. HoQ, as well as share recommendations for project teams.
First, let us look at these two tools.
A part of the Modern Blitz® QFD tool set, the purpose of the Maximum Value Table (MVT) is to deploy ONLY the highest priority Customer Needs into a solution design, build, and commercialization such that every necessary action to satisfy those needs is taken by each and every relevant organization department in a timely and quality way. No step must be overlooked. This is how customer satisfaction with the new product is assured.
The MVT is not constructed in one meeting, but it is populated as the design progresses, with each department adding its information in reflection of prior entries and in anticipation of later entries. It creates a traceable record that illustrates how every necessary action to achieve customer satisfaction has been sufficiently performed. It is best to limit the MVT only to the critical few customer needs, not the trivial many. Otherwise, it grows too large to manage.
The columns of the MVT vary, according to the organization, product, customer, technology, and other criteria. There is no optimum set or number. One way to identify the columns would be to look at the current or similar product's specification sheet, where you may find sections such as functions, mechanical properties, electrical properties, testing and regulatory, usability, reliability, materials, packaging, and other elements of design. Another way is to juxtapose an organizational chart above the MVT columns to identify which departments own which columns. This helps assure that all relevant departments give timely input.
It is important to appreciate that only with a true multi-functional team can all of the MVT columns get addressed. This is exactly how it assures the final shipped product will satisfy the highest priority customer needs. When QFD Green Belt® students become frustrated with the MVT, whether in a public course or in-company classes, it is because many of the columns are out of scope for their responsibilities. For example, marketing or product development engineers may only be tasked with writing a new product Market Requirements Document (MRD) which may include only 3 or 4 of the MVT columns. R&D engineers may only be tasked with writing a Product Requirements Document which may overlap some columns of the MRD and add additional columns from the MVT. Software engineers, manufacturing engineers, production engineers may own different columns, as well. This forces cross-functional collaboration toward a common business goal.
Finally, the columns of the MVT are indicators of what, if any, QFD matrices from the Comprehensive QFD toolset described in the eight parts of ISO 16355 may be useful for more detailed analysis. As will be explained below, a QFD matrix is an effect-to-cause relationship matrix between two data sets. This means that any two MVT columns that share a relationship could be juxtaposed into a matrix that would indicate the strength of the relationship and transfer the weights of the rows into weights for the columns. The most well-known QFD matrix is the House of Quality which juxtaposes a large set of Customer Needs against a large set of Functional Requirements. These two columns, Customer Needs and Functional Requirements are commonly found at the start of the MVT.
In summary, the MVT achieves its purpose of providing maximum value to the customer by assuring their highest priority problems, opportunities, and image concerns are resolved by the new product or service. The MVT provides maximum value to the organization by aligning all critical resources (time, people, money, information) to develop and commercialize the new product or service. Value is achieved only when the customer chooses our new product or service and puts it into service to satisfy their needs.
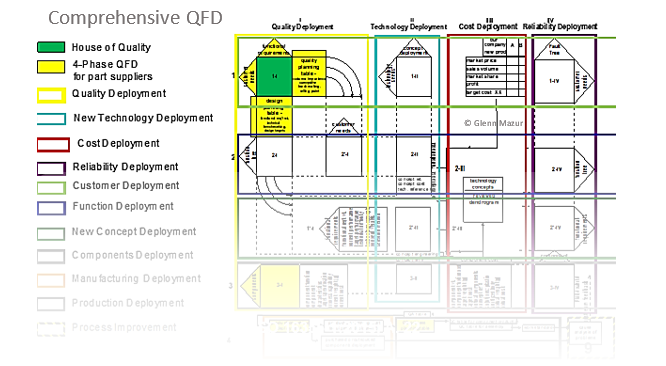
The House of Quality (HoQ) is the most well-known instance of the thirty-something Comprehensive QFD matrices. As explained above, a QFD matrix indicates the strength of relationship between each row and each column in the matrix, and uses a quantification of that relationship to transfer row weights into column weights.
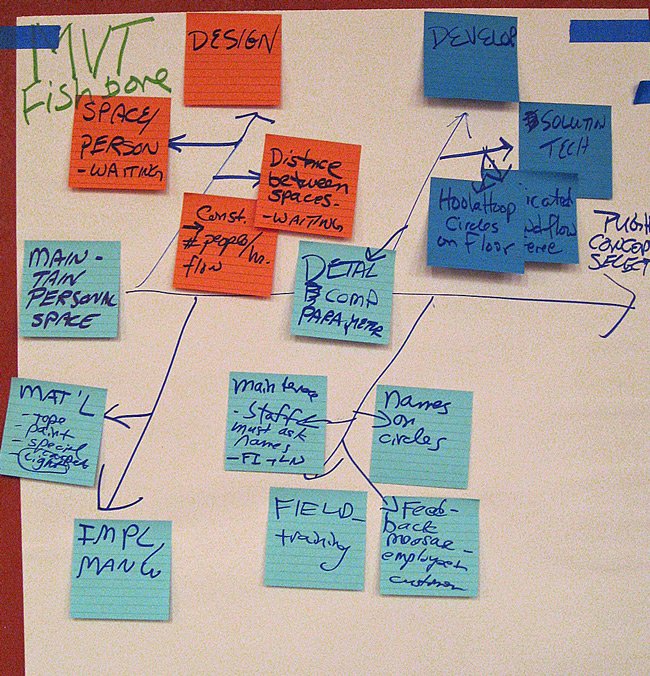
The relationship most often indicated in QFD matrices is an effect-to-cause relationship. The effects are typically placed in the rows and the causes are placed in the columns. It is similar to a Six Sigma cause-and-effect diagram (fishbone diagram) with the "head" indicating the effect and the "bones" indicating how to cause the effect. However, unlike the Six Sigma cause-and-effect diagram where the effect is a negative and the causes of failure are identified, the QFD effect is a positive (for example a customer need) and the causes of success or fulfillment are identified.
Thus, the MVT is essentially an effect-to-cause diagram for one customer need deployed to many product requirements needed to fulfill it. The QFD House of Quality is essentially a collection of many customer need effect-to-cause diagrams combined into a matrix.
Note that the bones or columns in the HoQ are only functional requirements; QFD matrices only relate two information sets at a time. Other information sets (function, characteristics, technology, reliability, safety, cost, etc.) may be combined in other Comprehensive QFD matrices. If we reverse the position of the fishbone diagram "head" or effect box to the left, it is easier to recognize this collection of diagrams as a QFD matrix. MVT can include a small subset of every information set that relates to the one Customer Need being analyzed.
The inputs of the HoQ are the prioritized Customer Needs in the rows and the outputs are the prioritized Functional Requirements. Transferring the Customer Need weights into Functional Requirement weights is typically done using Independent Distribution calculations (in Excel this function is called SumProduct). These calculations do not support the use of ordinal scale numbers, which was inherited from Japanese QFD in the pre-computer 1960s when a more commonly available calculation tool was an abacus.
In the late 1980s, the QFD math was upgraded to more precise ratio scale numbers based on the analytic hierarchy process (AHP) and other best practices from Multicriteria Decision Making theory. This upgrade is now taught in the QFD Green Belt® training (including Excel worksheets) and guidance is detailed in the ISO 16355-5:2017 standard.
The HoQ only relates Customer Needs to Functional Requirements. For other information sets such as technology, systems, components, reliability, tests, human factors, manufacturing, production, quality, cost, support, etc. additional matrices may be useful.
Weights from upstream, matrices can be cascaded into downstream matrices, thus preserving customer priorities throughout the entire analysis. Because each matrix will transfer row weights into column weights, it is essential that ratio scale numbers be used for both the information set weights and the relationship strengths. Ordinal numbers which are a legacy of the pre-computer QFD should be avoided. Note that when fixed targets are involved, such as cost or weight (mass), the Independent Distribution is replaced with Proportional Distribution. This is detailed in the QFD Black Belt® training and in ISO 16355-5:2017 and ISO/TR 16355-8:2017.
Maximum Value Table |
House of Quality |
|
|---|---|---|
Advantages |
|
|
Disadvantages |
|
|
Recommendations
Using both MVT and HoQ provides the plusses and avoids the minuses.
After getting customers to prioritize their needs using AHP (captures priorities in more useful ratio scale numbers), examine the scores to see where the "drop" in priorities first occurs. Typically, there are only 3-5 needs that need big improvements.
Deploy these critical-to-customer needs into the first few columns of the MVT to identify key functional requirements and solution alternatives. Base on the resource availability of people, time, and money, determine which of these needs can be deployed end-to-end throughout the organization.
Begin detailed design and development of these most critical customer needs. Invite subject matter experts to join the QFD team when needed. Detail important information in the appropriate MVT columns as it becomes known.
If resources exist to address all customer needs, then consider deploying them in a House of Quality. During the time it takes to build the HoQ and other matrices, continue the MVT deployment. Should resources or scope change, the MVT assures the most critical-to-customer needs will still be addressed. The MVT will also guide which QFD matrices will be needed.
Even if only the MVT can be completed, HoQ and other matrices can be constructed later after several MVTs have been made on similar projects. The benefits of Comprehensive QFD matrices are achieved by spreading the effort over several projects, instead of just one.
Both Modern Blitz QFD® and Classical Comprehensive QFD play a role in the QFD experts' toolbox. Often, the MVT can replace the HoQ when resources are constrained, or can be used to model which Comprehensive QFD matrices are needed. There is no penalty to doing the MVT first, because by definition, the highest priority information derived from QFD matrices should already be in the columns of the MVT. A well executed MVT is more valuable than a poorly or partially deployed HoQ matrix.
When you Google-search QFD, you get all kinds of misinformation online. Wikipedia is not immune either. So if you are still confused whether to deploy customer needs into the Maximum Value Table or into the HoQ and other matrices, please contact us or join us in the next QFD Green Belt® and QFD Black Belt® training —now offered as live online workshops.