When we showed one EU company recently how they could apply QFD more efficiently without using a House of Quality matrix (HoQ), the mood of the project team changed from being skeptic ("you must be kidding") to a sigh of relief ("we are freed from torturous matrices") to feeling exuberant ("we can finally do product development faster and smarter").
For many years, we have been saying that you can do QFD without a HoQ. Many either resist this change or do not know how to change, and still use the 1960s House of Quality QFD for a 21st century marketplace.
There seem two notable misconceptions that prevent project teams from modernizing:
They believe that the HoQ is QFD;
They think the Voice of the Customer is the true customer needs.
Let's examine these misconceptions.
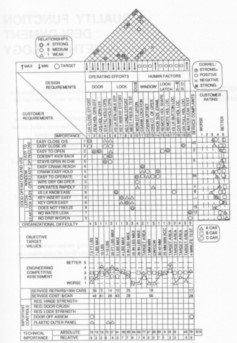
House of Quality Table (HoQ)
The House of Quality (HoQ) is an assembly of several deployment hierarchies and tables, including a Demanded Needs Hierarchy, the relationships matrix, the Quality Planning Table, etc. This matrix has been the focal point in most non-Japanese QFD books, but in fact, it is simply one of many tools in QFD from the Japanese 7 Management and Planning tool set.
As such, a House of Quality matrix can be used in many non-QFD studies. Further, having this matrix does not always means it is QFD, as Dr. Akao (founder of QFD) has repeatedly warned—even though there are still people who incorrectly assume anything resembling this matrix must be QFD.
QFD uses several tools iteratively. You have to know which tool is best for what you are trying to achieve.
Actually, the HoQ is a bridging matrix between two other matrices. So, if your project does not need the matrix before or after the HoQ, there may be no need to build a bridge (i.e., HoQ). In many product development projects today, the HoQ is not needed. It may be even detrimental in technology-driven QFD because of its propensity to limit solutions.
The Voice of the Customer (VoC) Analysis
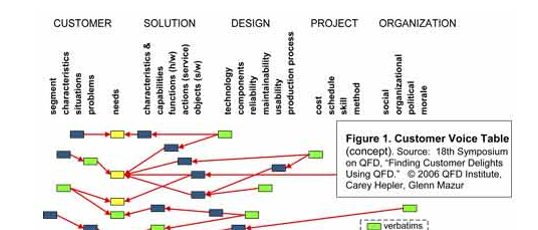
Another misuse can be traced to people's confusion about the Voice of the Customer (VoC) and customer needs. The VoC is the raw input from the customer. It may include verbatims, behaviors, documents, survey results, feedback data, etc. They contain many data types such as customer wants, safety, components, materials, failure modes, price, tasks, testing requirements, and so on. Not all of these are customer needs. The Customer Voice Tables below, from a case study presented at the 2006 Symposium on QFD, illustrates how to translate VoC into customer needs.
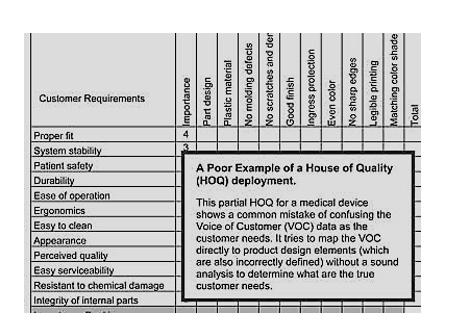
When people confuse the Voice of the Customer and customer needs, they try to put all of the data into one matrix. This is a fundamental mistake, which we even see in published QFD books and academic papers. (We’ve discussed this many times in our newsletters.) When this happens, you end up with an oversized HoQ table, which takes many man-hour to complete but gives you little new information.
One of the above diagrams is an example of incorrectly done HoQ analysis. It tries to map the VoC directly to product design elements without a sound analysis to determine what are the ‘true’ customer needs. Both the customer requirements (left column) and product attributes (top row) are incorrectly defined in this example.
Modern QFD Tools for Sound VoC Analysis
The goal of QFD is to bring value to customers — as measured by their level of satisfaction. Customers are not always able to tell you what they want or what they hope to achieve with the use of your product; nor do they always know exactly what they want.
So your job, as a new product developer and business process innovator, is to identify the "true" customer needs out of the Voice of the Customer by using Modern QFD's analytic tools. Without this extra step, your downstream deployments such as the HoQ will be an inefficient use of resources.
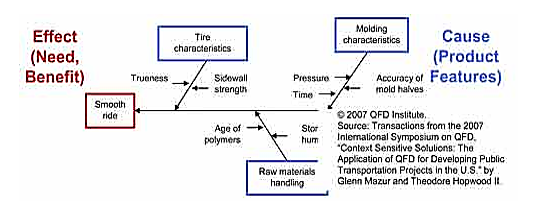
Another diagram is an example extracted from Bridgestone Tire (Japan) who published the first use on QFD in 1966. Using the fishbone diagram to illustrate the cause and effect relationships, they were able to determine the true customer needs (red box) that underlay various customer verbatims in the VoC data.
For example, a customer asked for his tires to be trued (a technical process). Using this fishbone, they understood that his real need was a "smooth ride," that tire truing was one way to achieve it, and that there could be others at the design, process, and material handling stage that could be used in combination to make the ride smoother.
Extracting true customer needs is much easier with the recent advancements of Modern QFD. We now have several more efficient, robust tools that were not in the 1960s QFD or nor in the HoQ method.
These include the Customer Voice Tables (CVT) and "mini-matrices" that are more efficient than large HoQ matrices, especially for today's businesses that face limited budgets, human resources, and development time.